
NFHS – 4 provides, for the first time a district-level data on nutritional status of children below the age of 5 years. This provides an excellent and timely opportunity to plan for eradication of child malnutrition at the district level. A quick preliminary analysis of the district level child malnutrition levels, reveals certain important aspects. This is presented below.
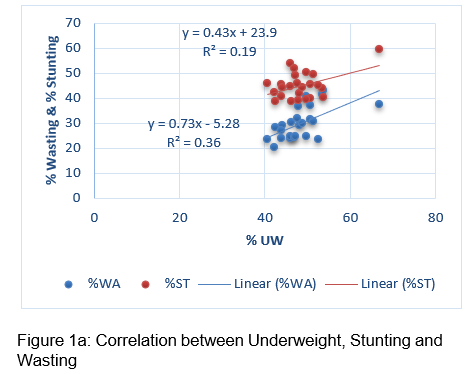
Table-1 presents the data on wasting, underweight and stunting in a colour coded form. These three aspects of child malnutrition are interrelated. This relationship is brought out in Figure 1a. There is a clear linear relationship between underweight with stunting on one hand and wasting on the other. The robust nature of both the linear regressions (R2 of 0.36 for stunting and 0.2 for wasting), has a bearing on programme implementation. Collecting good quality data on underweight can give us a good indication of the levels of wasting and stunting as well. Hence, we need not initiate routine measurement of height through Anganwadi workers or ASHAs. The task of estimating stunting can be left to periodical NFHS surveys which will now be taking place at 3 year intervals. At Anganwadi level recording weight and use of MUAC tapes to identify wasting will be adequate at this stage.
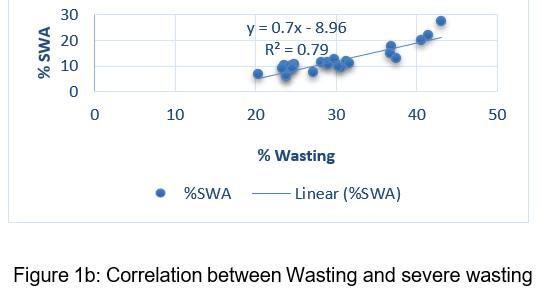
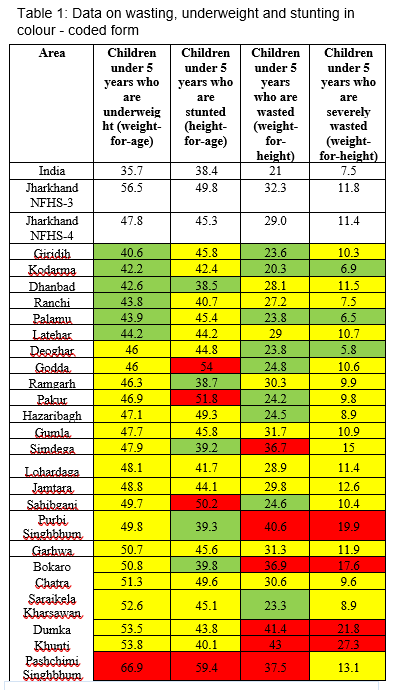
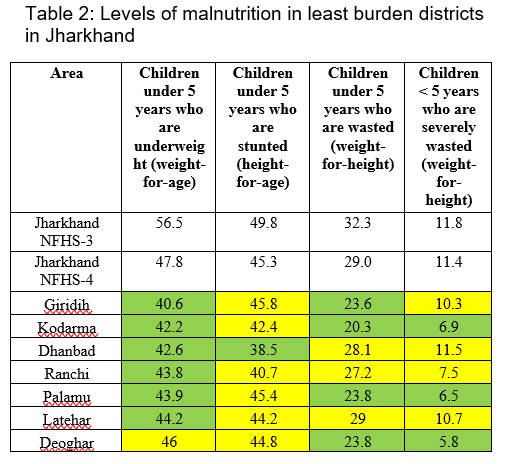
The data in Table – 1 is arranged in the descending order of % underweight figures. This brings out the low levels of severe wasting in the districts of Deoghar, Palamu and Kodarma. Districts which have low figures of severe wasting have mostly got other parameters right. Table-2, quite clearly, brings out the importance of reducing the incidence of severe wasting. The high R2 value of 0.8 between Wasting and Severe Wasting also points towards similar observation (refer fig. 1b).
Table 1 & 2 also shows the regional contiguity of the parameters and the need for separate planning for different districts. Four of the best performing districts are situated in the Bihar border. Four of the poor-performing districts in terms of wasting share borders with West Bengal.
The regional dimension of the situation can be readily appreciated if we look at Jharkhand’s map as brought out in Figure 2a-2d below. The maps clearly show three separate clusters in green, yellow and red corresponding to the least, middle level and high malnutrition. In figure 2a, we can see two green clusters of Palamu, Latehar, Ranchi and Koderma, Giridih, Dhanbad for % underweight children. In figure 2b, there is a red cluster of 3 districts in the Jharkhand-Bihar-West Bengal border, which have higher stunting prevalence. Ranchi just missed the green colour code in stunting by 0.7 percentage points and in severe wasting by 0.5 percentage points. West Singhbhum remains a poor-performing district, lying in the red colour code for % Under-weight, % Stunting and % Wasting. Palamu and Koderma comes out as the best-performing districts with better underweight and wasting figures.
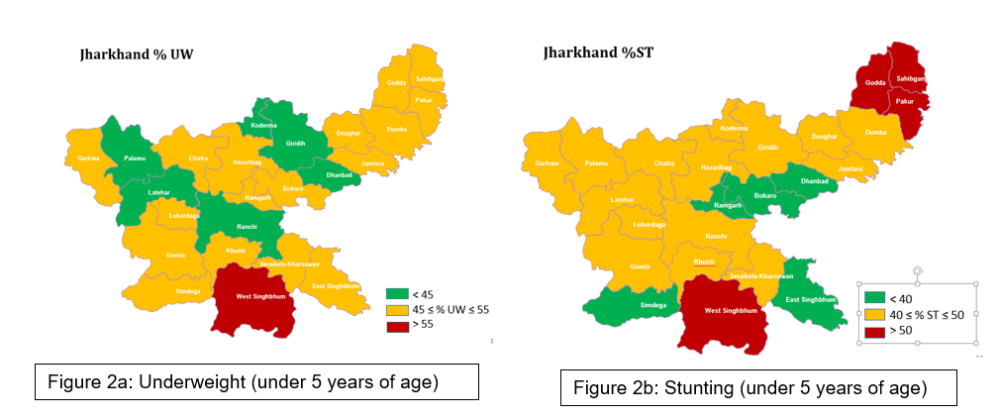
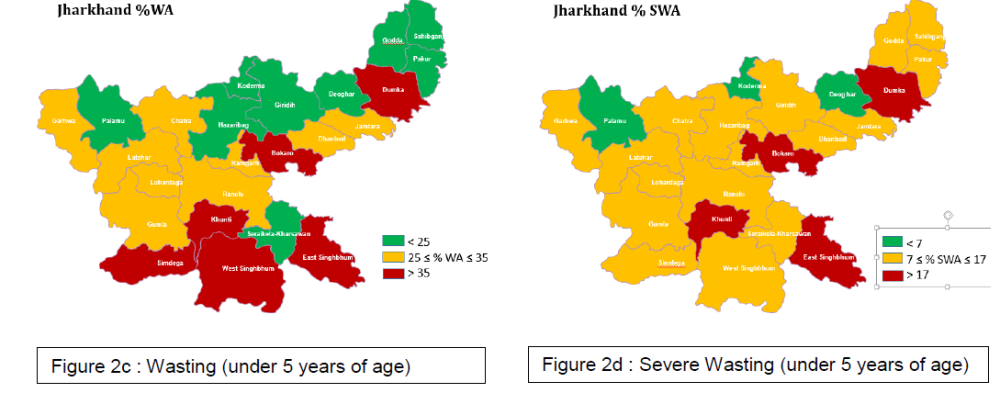
North-Eastern zone comes out as a better performer in % wasting figures (refer fig. 2c). One area of focus would be the districts of Palamu and Koderma which is ‘closest to the goal-post’ of removing moderate and severe malnutrition. The next best performing districts are Deoghar and Ranchi. These are “positive deviants” within a state which we need to identify, celebrate and push systematically towards becoming malnutrition free. Such a shift of emphasis from high burden to low burden districts is necessary given the goal of achieving a malnutrition free India with emphasis on district level planning, convergent action and monitoring.
Having identified these districts, we next look at various correlates of malnutrition and find out the districts which have performed well above the state average in respect of maximum number of correlates. NFHS-4 provides data in respect of a number of such parameters. We have selected 43 such parameters and have arranged these in the life cycle sequence starting from the new born to the adolescent girl and the pregnant mother.
The parameters have further been organized into major clusters i.e. child anthropometry, infant and young child feeding practices, immunization, management of diarrhoea and ARI, women’s marriage, health, ante-natal care, post-natal care and educational background among others. These indicators have again been colour coded depending upon their levels with respect to the state-level averages, and in some cases where the state average is itself rather low, the colour coding has been done in terms of absolute performance.
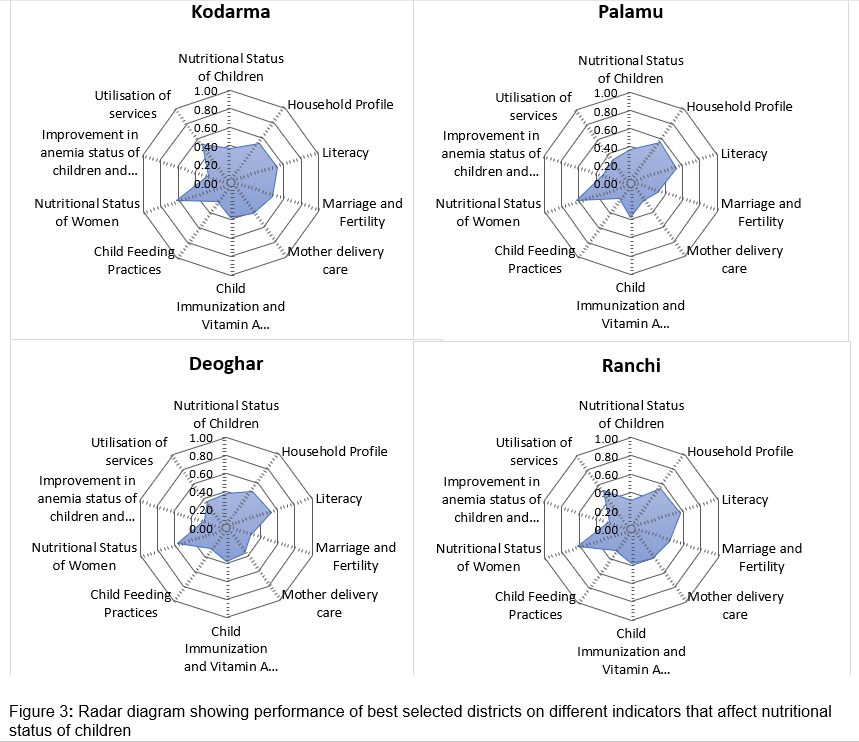
Kodarma and Ranchi have higher number of best performing indicators, not Palamu and Deoghar. Further, these two districts perform below par mainly in the IYCF segment, i.e. early initiation of breastfeeding, and adequacy of diet to young children. Other two important parameters are sanitation coverage and mothers with 10 plus years of schooling.
The above analysis is represented through radar diagram where each cluster has been assigned certain score and the achievement of the district marked against the full score (refer fig 3). While doing an individual district analysis, it is also possible to do a full parameter radar diagram. Such a radar diagram allows the district to prioritize its areas of intervention. The issue of relative weightage of these parameters will however, remain. That will be taken up separately.
Burden of the problem
We now turn to an interesting aspect of the problem- the burden in absolute numbers. Every district would like to know the absolute number of underweight or malnourished children in their district. We have used an easy but reasonably accurate estimate based on the census 2011 data for children in the 0-6 year age group. This number represents seven cohorts. As such 5/7th of this figure would give a rough estimate of the children below 60 months (5 years) in the given district. Then using NFHS-4 data we further estimate the number of malnourished children.
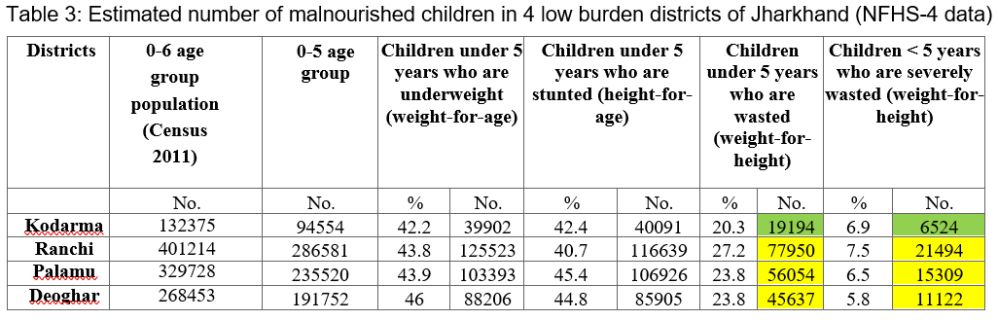
Table 3 shows that Kodarma have the least burden of malnourished children in absolute number followed by Deoghar. In fact, the number of severely wasted children in Kodarma is 6500. The corresponding figure for moderately wasted children is about 19,000. While children that are underweight and stunted are about 40,000. It can be nobody’s case that these districts cannot take up the task of reducing malnutrition in a campaign mode and achieve early results. The time to begin this is NOW!
IMR by NSSO Regions in Jharkhand
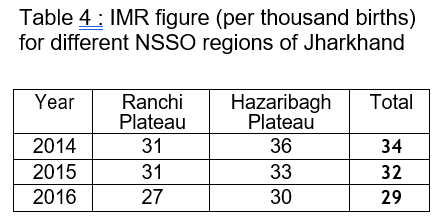
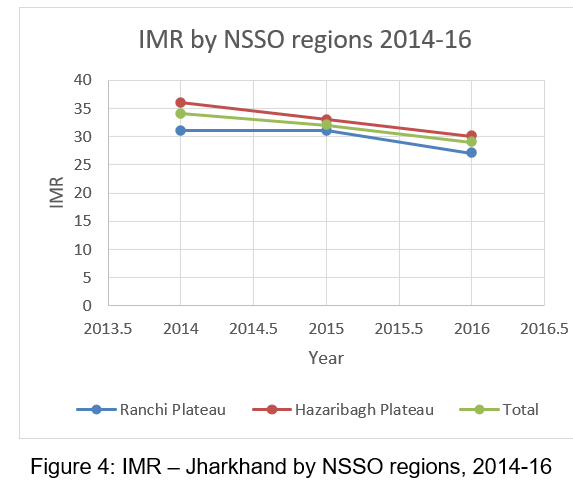
Child malnutrition is a major contributing factor in child mortality. Hence, in table 4 and the figure 4 below we analyse the time series IMR data from the SRS by NSSO regions. We need to be cautious in treating the state averages as a monolith since these hide considerable regional variety.
The analysis of the IMR data from the SRS as per the NSSO regions show comparable IMR for both the regions across 2014-16. The hazaribagh Plateau region have done slightly better in reducing IMR than the Ranchi Plateau region (refer table 4). Figure 4 clearly shows that the IMR gap between the Ranchi Plateau and the Hazaribagh Plateau region have decreased from 2014-16, though the former remains a consistently better performer. The average IMR for the state have also decreased.
Prof. Satish B. Agnihotri
Aparajita Patra
Ayushi Jain